
 |
 |
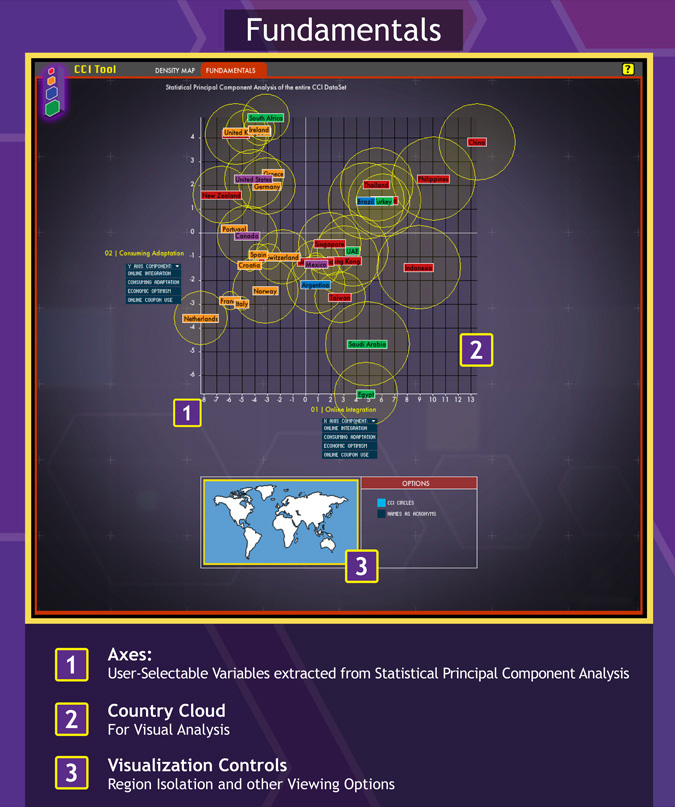
Interactive Application for the Visualization of multiDimensional Consumer Confidence Index Poll data. It enables the analist to display data using a variety of filters, sorting algorithms, and view options. It consist of 2 main configurations: The Density Map, and the Fundamentals Map. The tool's Density Map Mode aims at raw data display and analysis, focusing on visual pattern recognition, while the Fundamentals Graph Mode allows for a big picture, a qualitative viewpoint. Combined, they generate a data exploration platform for complex data that allows the analyst to combine its previous knowledge of the field in question, with a fluent data navigation and sorting, along with the capacities of the primitive visual cortex, excellent in visual processing, in order to make sense of Big Data. Check out both videos:
Project Lead, Graphic Design and Coding: Coding, Sorting Algorithms, Data Analysis and Video Script/Narration: Principal Components Analysis: Aditional Coding: Coordination: Additional Help: |
 |
// Density Map |
 |
// Fundamentals Map |